
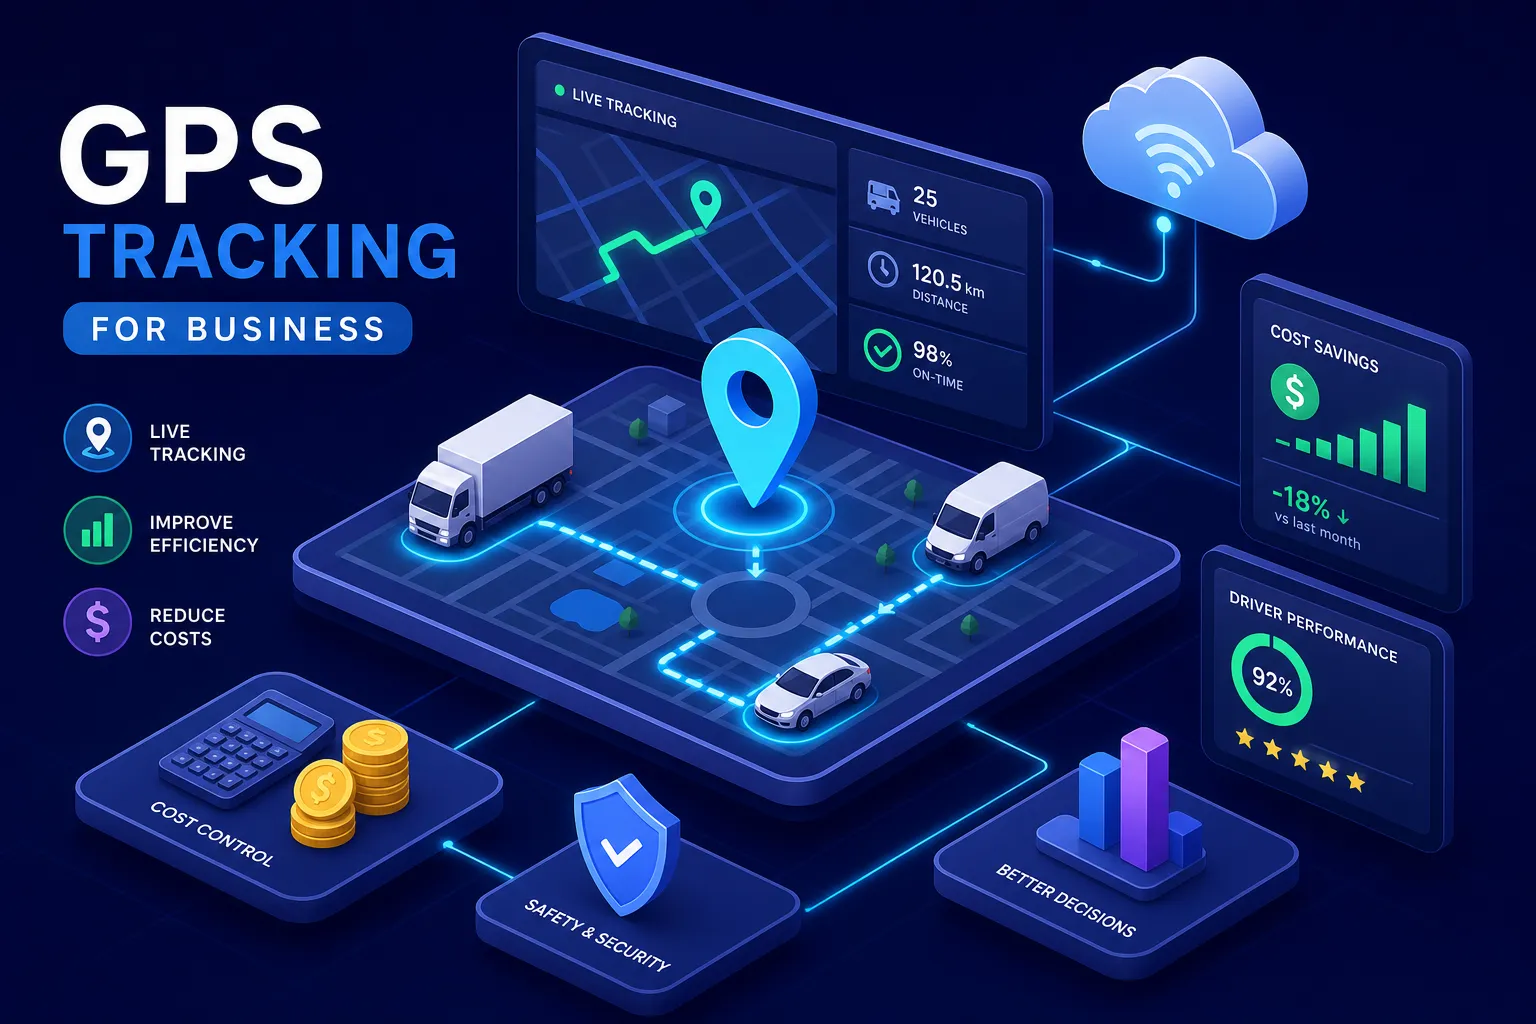
If you’re trying to figure out what GPS features help the most with cutting transport business expenses, the answer isn’t a single tool, it’s a prioritized stack. Most transport business owners point to fuel prices or driver wages when costs spiral out of control. Those are real pressures, but they’re not the whole story. A significant share of what you’re spending every month is preventable, leaking out because your fleet is invisible to you once those vehicles leave the yard. Industry benchmarks suggest that combined telematics interventions typically produce 10, 30% cost reductions across fuel, maintenance, and labor.
Fuel alone can represent 25, 60% of a fleet’s operating costs depending on fleet type and operation. The good news is that a meaningful portion of that is recoverable, not through cutting staff or negotiating fuel contracts, but through deploying the right GPS and telematics features on your existing vehicles. Easy Track reports that fleet operators running integrated tracking systems across East Africa have documented savings across fuel, insurance, and maintenance simultaneously, often within the first 90 days.
The catch is that not every GPS feature delivers equal ROI. Some save you money immediately; others compound over time. This guide focuses on the features with the highest impact, in order, with real numbers behind each one.
Fuel monitoring and idle time detection: the fastest path to savings
These two features consistently deliver the most visible, immediate results for fleets of any size, often cutting fuel costs by 10, 25% within the first few months. If you only implement one category of GPS features to cut transport business expenses, start here.
Real-time fuel monitoring: more than watching a gauge
Real-time fuel monitoring tracks consumption rates, logs fill-up events, flags drain alerts, and calculates consumption-per-kilometer ratios for every vehicle in your fleet. That last metric is the one that surfaces problems you didn’t know existed: routes that burn more fuel than they should, drivers who consistently run higher consumption numbers, and fill-up patterns that don’t match mileage records.
The theft angle is one most fleet managers underestimate until they see the data. Fuel siphoning and overfilling schemes are common in unmonitored fleets, and they’re nearly impossible to detect without sensor-level data. Fleets combining GPS tracking with fuel sensors typically identify 10, 20% in preventable fuel losses within the first 60 days. That’s not a projected saving; that’s money that was already being spent and is now recovered.
Idle time detection and what it’s costing your fleet right now
Heavy vehicles can idle anywhere from 20% up to 40% of their operating time depending on vehicle class and route type. Each hour of unnecessary idling burns 0.5 to 1 gallon of fuel, depending on engine size. For a fleet running 20 trucks on a standard workday, assuming even modest idle rates, wasted fuel costs can add up to hundreds of dollars daily with nothing to show for it.
Automated idle alerts change driver behavior fast. When paired with weekly driver scorecards, fleets typically see a 15, 23% reduction in idle time within 90 days. One construction fleet cut idling by 37% and saved over 5,000 gallons of fuel annually. Those aren’t outlier results. Measurable fuel savings from idling alerts often appear within the first 30 days, which is faster payback than almost any other telematics feature.
Route optimization and geofencing: cutting kilometers before the truck moves
Fuel monitoring tells you what happened. Route optimization and geofencing prevent the waste from occurring in the first place. These GPS features reduce mileage, unauthorized use, and overtime costs before a trip becomes a cost problem.
How route optimization reduces your total kilometers driven
Dynamic route optimization uses real-time traffic data, load-optimized sequencing, and automated rerouting to ensure drivers take the most efficient path, not just the most familiar one. The mileage impact is substantial: route optimization typically cuts total fleet distance driven by 10, 20%, compounding savings across fuel, tire wear, and driver overtime at the same time.
Unoptimized routes can add 15, 25% in unnecessary distance. Multiply that by your annual mileage and current fuel cost, and the number gets uncomfortable fast. UPS’s ORION routing system saves roughly 100 million miles annually across its fleet, translating to an estimated $300, $400 million in annual savings. The scale differs for smaller fleets, but the percentage savings are consistent across fleet sizes.
Geofencing as a dispatching and cost-control tool
Geofencing creates virtual boundaries around specific locations, depots, job sites, client locations, or restricted zones. When a vehicle enters or exits those boundaries, the system triggers an alert. That sounds simple, but the cost-control applications run deep.
Unauthorized vehicle use, unscheduled stops, and route detours quietly inflate fuel and overtime costs in ways that never show up clearly on a fuel receipt. Geofencing makes those deviations visible and attributable. Geofenced job sites also improve dispatch accuracy, reducing the empty trips that happen when drivers and dispatchers aren’t working from the same real-time picture. These are widely reported benefits across fleet telematics deployments, even where precise industry-wide data varies by operation type.
What GPS features help the most with cutting transport business expenses? Driver behavior monitoring ranks high
Most fleet managers focus on where their vehicles are. The bigger financial lever is how drivers are operating those vehicles. Driver behavior monitoring is one of the highest-ROI GPS features available for cutting transport business expenses, and it’s consistently underused.
The direct fuel and wear costs of aggressive driving habits
Speeding, harsh braking, and rapid acceleration drive the majority of preventable costs in this category. Aggressive driving increases fuel consumption by 15, 30% compared to smooth, consistent driving. That’s not a small variance; on a large fleet, it’s the difference between a profitable quarter and a loss.
Harsh braking and rapid acceleration don’t just burn fuel, they accelerate wear on brakes, tires, and transmissions, pushing maintenance intervals forward and adding unplanned repair costs. Every harsh braking event recorded by your telematics system is a data point that connects directly to a future repair cost. Capturing that data gives you the ability to intervene before the bill arrives.
Driver scorecards and the insurance premium angle
Automated driver scorecards translate raw event data into performance scores per driver. Those scores serve two purposes: they give managers a prioritized list of who needs coaching, and they give insurers documented proof of safe fleet operations. Fleets using behavior monitoring report an average 13% drop in insurance premiums, with many providers offering 10, 25% enrollment discounts simply for running a telematics program.
The accident reduction numbers are equally significant. Structured monitoring with coaching reduces at-fault accident rates by 20, 35% within 18 months. A 20% accident rate reduction cuts claims costs, reduces the downtime from vehicles sitting off-road after incidents, and often creates direct leverage in premium negotiations at renewal. For a mid-sized fleet, those combined savings frequently exceed the cost of the telematics system by a wide margin.
Engine diagnostics and predictive maintenance alerts: stopping breakdowns before they happen
OBD-II and CAN bus diagnostics are the most overlooked feature category in fleet telematics. Most fleet managers think of GPS as a location tool and handle maintenance separately. That separation is expensive.
Why real-time fault code alerts outperform scheduled service intervals
OBD-II and CAN bus diagnostics read engine temperature anomalies, pressure faults, sensor failures, and manufacturer-specific diagnostic codes in real time. Advanced diagnostics provide an average three-week advance warning before a fault code becomes a breakdown event, three weeks to schedule a repair during planned downtime rather than scrambling after a roadside failure.
Scheduled maintenance replaces parts by calendar, not by condition. Condition-based monitoring changes that entirely. A filter scheduled for replacement at 10,000 kilometers may be fine at 12,000 under light-duty use, or critically degraded at 8,000 under heavy load. Monitoring actual component condition extends part life and avoids premature replacement costs while also catching failures that scheduled service would have missed entirely.
The real cost difference between planned and unplanned breakdowns
Unplanned maintenance costs 3, 9 times more per incident than a planned repair. That multiplier accounts for emergency labor rates, expedited parts shipping, towing fees, driver downtime, and the operational disruption of pulling a vehicle from active routes without notice. In dollar terms, OBD-II monitoring translates to an estimated $1,200, $2,500 per vehicle in avoided emergency repairs and roadside call-out costs annually.
Real-time diagnostic alerts reduce unplanned breakdowns by up to 75% and reduce fleet downtime by 30, 50%. Those numbers compound in ways that go beyond the repair bill. Fewer breakdowns mean better route reliability, fewer missed delivery windows, and less client fallout from service failures. The maintenance savings are real; the downstream operational stability is equally valuable.
Why an integrated telematics platform outperforms single-feature tools
Each feature covered above delivers real savings on its own. The larger opportunity is in combining them, and that’s where platform choice matters.
The vendor fragmentation problem
A common setup in transport businesses looks like this: one app for GPS location, a separate device for fuel monitoring, a third system for driver scoring, and none of them communicating with each other. Each system reports in its own silo, which means you see the symptoms but not the connections.
The real savings come from correlating data across features simultaneously. A driver with a high harsh braking score and elevated fuel consumption on the same route is a different problem than a vehicle showing the same fuel spike alongside an active fault code. Fragmented systems can’t surface that kind of insight. Duplicate hardware contracts, inconsistent data formats, and high IT overhead compound the problem further.
How Easy Track’s all-in-one fleet solution removes the fragmentation problem
Easy Track is a fleet telematics provider built specifically for the East African market, combining GPS tracking, fuel monitoring, driver behavior alerts, idle detection, geofencing, and engine diagnostics in a single, locally compliant platform. One system. One dashboard. One contract.
The compliance angle matters for fleets operating in Tanzania and across the region. Easy Track holds TRA approval for Electronic Cargo Tracking Seals (ECTS) and LATRA approval for VTS compliance, meaning transport businesses can manage costs and meet regulatory requirements through a single vendor. For importers, exporters, intercity bus operators, and logistics companies moving goods through Tanzanian ports and borders, that dual certification removes significant operational complexity. You’re not piecing together solutions from vendors who don’t share data or accountability.
Estimating your ROI and choosing which GPS feature to deploy first
The data across every feature category points to the same conclusion: GPS and telematics pay for themselves quickly. But knowing where to start depends on your biggest cost driver right now.
What the payback period data actually shows
Small fleets with 1, 10 vehicles typically reach payback in 4, 6 months. Medium fleets with 11, 50 vehicles often see ROI in 3, 5 months, partly because better pricing tiers make the economics work faster. Industry benchmarks suggest that 41, 47% of fleets achieve positive ROI in the first year, with roughly a third reaching payback in under six months.
The annual savings breakdown is broadly consistent across industry research: 10, 30% fuel reduction, 5, 25% insurance savings, 10, 15% maintenance cost reduction, and recoverable labor costs of roughly $22,000 per year per 10 vehicles. Those figures are cumulative, not competing. A fleet deploying fuel monitoring, driver scorecards, and engine diagnostics simultaneously isn’t adding up three separate small savings, it’s compressing the payback period because each feature reinforces the others.
A simple framework for choosing your first feature
Start with your current cost breakdown, not a feature list. If fuel is your biggest expense, begin with fuel monitoring and idle detection. If accident claims and insurance premiums are the problem, driver behavior monitoring delivers the fastest measurable impact in that category. If unplanned breakdowns are disrupting operations regularly, engine diagnostics and predictive maintenance alerts should be your first deployment.
The features compound as you add them. Each layer increases the data available for the others, which is why ROI accelerates as your platform expands. The goal isn’t to implement everything at once, it’s to identify where your fleet is hemorrhaging money right now, address that first, then build from there.
The cost of running unmonitored vehicles is now provably higher than equipping them
GPS features don’t just tell you where your vehicles are. The right combination tells you why your costs are high and exactly where to cut them. Route optimization, fuel monitoring, driver scorecards, idle detection, and engine diagnostics together typically deliver 10, 30% cost reductions across a fleet within the first year, a figure consistent across studies covering thousands of commercial vehicles.
The real multiplier is a system where all these features feed into a single data view. Isolated tools reporting in silos give you fragments. An integrated platform gives you the complete picture, including the connections between driver behavior, fuel consumption, route efficiency, and maintenance events that reveal where the real money is going.
For transport businesses operating in East Africa, Easy Track provides that unified platform with the added advantage of built-in government compliance, no patchwork of vendors, no compliance gaps, and no duplicate contracts. If you want to know what GPS features help the most with cutting transport business expenses, start with fuel monitoring, idle detection, and driver scorecards, then layer in diagnostics and route optimization as your operation scales. Ready to audit your fleet’s current cost structure? Reach out to the Easy Track team for a no-obligation assessment tailored to your fleet size and route type.


 By
By